
 TruStatMind
AI agents for data analysis, built for market research
Upload a survey file and ask questions the way you would brief an analyst. The statistics engine works out every number, and the AI turns them into charts, tables and a story you can defend.
Every example on this page uses one fictional study: the Hearthpaw brand tracker, wave 4.
The Visual Deck
The right chart for every table
As market research analysis software, TruStatMind picks the chart that tells each finding best and writes the finding as the title. Single numbers become a graphic you can read at a glance. Hover over any chart to see its numbers.
Rank bars
Hearthpaw is trusted most in London
Likert
Half agree Hearthpaw is good value, ahead of Burrowby
Pyramid
Cat owners skew older than dog owners
Heatmap
Trust is highest among younger owners, for every brand
Lollipop
Supermarkets still sell most pet food, online is second
Bullet
Consideration is above the total among under-55s
People
About 2 in 10 owners switched brand in the last six months
Scale
Hearthpaw scores 3.4 out of 5 on value, above the category
- A chart chosen to fit each finding
- The finding as the title, every figure from the statistics engine
- Small bases drawn hollow and starred, never hidden
Younger owners trust Hearthpaw more than owners aged 55+
Trust Hearthpaw, by age · all pet owners (n=1,204), weighted
| Total | 18–34 (A) | 35–54 (B) | 55+ (C) | |
|---|---|---|---|---|
| Trust Hearthpaw | 46% | 52% C | 47% C | 38% |
| Don't trust or not sure | 54% | 48% | 53% | 62% AB |
| Base (weighted) | 1,204 | 402 | 431 | 371 |
| Effective base | 1,018 | 341 | 365 | 312 |
Significance testing: two-tailed tests at the 95% confidence level; proportions compared with a ; means compared with , using under weighting. A letter shows a column is significantly higher than the column with that letter.
Show the numbers
Every number shows its working
Turn any chart over to the table behind it. The footnote names the tests in plain words, so you can explain a finding to a client without opening a stats package.
- The engine calculates, the AI writes: the language model never changes a number
- Weighting done properly: tests run on effective bases
- Small bases shown, never hidden: drawn hollow and starred
Segments and derived variables
Describe a segment, see exactly how it was built
Ask for a new group in plain English. TruStatMind shows the rule it built, who falls into each group and who drops out of the base, before you use it in a single table.
- Rules checked in order, so nobody is counted twice
- Change it in words, and the rule and the counts rebuild
- Who drops out of the base is always shown
Make a segment of loyal advocates: people who'd recommend Hearthpaw 9 or 10 and bought it in the last 3 months.
Everyone who scored Hearthpaw 9 or 10 is split by whether they bought it in the last three months. Everyone else who answered goes into one group.
Source questions
Q12 How likely to recommend Hearthpaw (0–10)
Q8 Brands bought in the last 3 months
Rules · checked in order
- 9–10 and bought Hearthpaw → Loyal advocates
- 9–10 → Fans not yet buying
- Anyone else who answered → Everyone else
Result groups
Loyal advocates214 · 18%
Fans not yet buying131 · 11%
Everyone else813 · 70%
Change it in words
The analyst’s toolkit
Data analysis in quantitative research, beyond the crosstab
The methods a research analyst reaches for, run by the statistics engine and explained in plain words. Ask for them by name, or describe what you want to know.
Where each brand sits in owners' minds
Brand image · 5 brands and 6 attributes
| Item | Kind | Dim 1 | Dim 2 |
|---|---|---|---|
| Hearthpaw | Brand | 0.30 | 0.30 |
| Burrowby | Brand | -0.48 | 0.44 |
| Paddock | Brand | -0.62 | -0.36 |
| Fernley | Brand | 0.50 | -0.45 |
| Kestrel & Co | Brand | 0.72 | -0.14 |
| Natural ingredients | Attribute | 0.55 | 0.78 |
| Vet recommended | Attribute | -0.30 | 0.80 |
| Good value | Attribute | -0.86 | -0.58 |
| Premium | Attribute | 0.82 | 0.52 |
| Trusted | Attribute | 0.08 | 0.12 |
| Fun brand | Attribute | 0.80 | -0.74 |
See where each brand sits in people's minds
A correspondence map puts brands and attributes on one picture: a brand near an attribute is the one most linked to it. Here Hearthpaw sits between "Trusted" and "Natural ingredients"; Paddock owns "Good value".
- Calculated by the statistics engine from your brand-image grid
- Turn it over to its coordinates with "Show table"
- Also drawn as a slide in the Visual Deck
Trust goes with quality more than with price
Correlations between brand ratings · Hearthpaw buyers (n=561)
Strongest pairs, with 95% confidence intervals
- Trust × Quality0.62 [0.57, 0.67]
- Trust × Recommend0.58 [0.52, 0.63]
- Quality × Recommend0.55 [0.49, 0.61]
Which ratings move together
TruStatMind chooses the right correlation for your data and says which it used. Every result comes with a 95% confidence interval, so you can see how sure it is.
- A heatmap for the whole picture, the strongest pairs for the story
- Intervals, not just stars
Hearthpaw leads the category on NPS
Net Promoter Score by brand · buyers of each brand
NPS read the way researchers read it
Promoters, passives and detractors behind every score, with the base beside it, so an NPS never travels without its context.
- NPS = % promoters (9–10) − % detractors (0–6)
- NPS, means and percentages each tested on their own right base
Hearthpaw has gained in each of the last two waves
Would consider buying · waves 1 to 4 · all pet owners
Trackers, tested wave on wave
Cut any question by wave and TruStatMind draws it as a trend. Significance compares each wave with the one before, so a tracker's story is told on solid ground.
- Wave-aware testing on the effective base
- Paired tests (McNemar, paired t) when the same people rate twice
Also in the engine: key driver analysis (in the deck above), CHAID, PCA and XGBoost, each from a plain-English request.
Try it
Ask the sample study a question
Ask the Hearthpaw study a question, as you would in TruStatMind. It plans the analysis, runs it and shows the finding with its chart and the numbers behind it. Add the answers you like to My deck, then take the deck away.
Welcome to StatMind
Your Hearthpaw brand tracker (wave 4) is ready. Ask anything, from a single number to what drives brand preference. Try one of these:
Hearthpaw brand tracker · wave 4 · 1,204 respondents
| ID | Age | Region | Main brand | Consider Hearthpaw | Trust Hearthpaw | Recommend (0 to 10) | Weight |
|---|---|---|---|---|---|---|---|
| 1001 | 25 to 34 | North West | Hearthpaw | Yes | Agree | 9 | 1.08 |
| 1002 | 55+ | Scotland | Burrowby | No | Neither | 6 | 0.94 |
| 1003 | 35 to 44 | London | Hearthpaw | Yes | Strongly agree | 10 | 1.12 |
| 1004 | 18 to 24 | Midlands | Paddock | Yes | Agree | 8 | 0.87 |
| 1005 | 45 to 54 | South East | Burrowby | No | Disagree | 4 | 1.01 |
| 1006 | 55+ | Wales | Hearthpaw | Yes | Agree | 7 | 0.96 |
| Wave | Consider | Base |
|---|---|---|
| Wave 1 | 31% | 1,180 |
| Wave 2 | 34% | 1,192 |
| Wave 3 | 39% ▲ | 1,198 |
| Wave 4 | 46% ▲ | 1,204 |
| Total | 18–34 (A) | 35–54 (B) | 55+ (C) | |
|---|---|---|---|---|
| Trust Hearthpaw | 46% | 52% C | 47% C | 38% |
| Don't trust or not sure | 54% | 48% | 53% | 62% AB |
| Base (weighted) | 1,204 | 402 | 431 | 371 |
| Effective base | 1,018 | 341 | 365 | 312 |
| Brand | Agree (top 2) | Disagree (bottom 2) | Base |
|---|---|---|---|
| Hearthpaw | 49% | 24% | 874 |
| Burrowby | 41% | 29% | 902 |
| Driver | Share | 95% CI |
|---|---|---|
| Trust | 33% * | 27–39 |
| Quality | 26% * | 20–32 |
| Vet recommended | 18% * | 12–24 |
| Good value | 13% * | 8–18 |
| Natural ingredients | 10% | 5–15 |
| Answer | Share | Base |
|---|---|---|
| Switched | 19% | 1,204 |
| Stayed with the same brand | 78% | 1,204 |
| Not sure | 3% | 1,204 |
Full Suite crosstab agent
A whole tab book from one request
Describe the job, or upload your own tab spec. The crosstab agent plans every table, shows you the plan, then builds a formatted Excel workbook with the tests run and the marks explained.
- A one-line brief or your own tab spec
- A plan you check before anything runs
- Weighted tables with bases, letters and vs-Total marks, and the tests named on every sheet
- An editable tab spec comes back with the workbook, to change and re-run
What matters most (optional)
Cut every question by age group and region.
Planned tables 3
Banner variables
Columns on every table
Q4
Brand awareness
Base: All respondents
Rows (5)
HearthpawBurrowbyPaddockFernleyKestrel & Co
Columns (3)
TotalAge groupRegion
| Response | Total | Age group | Region |
|---|---|---|---|
| Hearthpaw | – | – | – |
| Burrowby | – | – | – |
| Paddock | – | – | – |
| Fernley | – | – | – |
Q7
Good value for money
Base: All respondents answering (n=890)
Rows (7)
Strongly disagreeDisagreeNeither agree nor disagreeAgreeStrongly agreeTop 2 Box (NET)+1 more
Columns (3)
TotalAge groupRegion
| Response | Total | Age group | Region |
|---|---|---|---|
| Strongly disagree | – | – | – |
| Disagree | – | – | – |
| Neither agree nor disagree | – | – | – |
| Agree | – | – | – |
Q12
Likely to recommend
Base: All respondents answering (n=554)
Rows (12)
123456+6 more
Columns (3)
TotalAge groupRegion
| Response | Total | Age group | Region |
|---|---|---|---|
| 1 | – | – | – |
| 2 | – | – | – |
| 3 | – | – | – |
| 4 | – | – | – |
3 automatic adjustments
- Added Top 2 Box and Bottom 2 Box to T2
- Added Column % and Mean to T3
- Recognised "Don't know" answers
Run settings
Weighted · significance tests on · low bases flagged
3 tables · 2 banners
Base
3 tables · 5 Excel sheets
| ID | Title | Metrics | Nets | View |
|---|---|---|---|---|
| T1 | Brand awareness | Column % | — | |
| T2 | Good value for money | Column % | Top 2 Box, Bottom 2 Box | |
| T3 | Likely to recommend | NPS · NPS Groups · Column % | — |
No tables match that search.
T1
Q4 · Brand awareness
Q4. Pet Food Brand Awareness
Base: All respondents
| Total | Age group | Region | ||||||||
|---|---|---|---|---|---|---|---|---|---|---|
| Total | 18-34 | 35-54 | 55+ | London | South East | Midlands | North | Scotland | Wales and South West | |
| a | b | c | a | b | c | d | e | f | ||
| Base (n) | 1,204 | 402 | 431 | 371 | 210 | 262 | 241 | 288 | 38 * | 165 |
| Hearthpaw | 75%906 | 75%295 | 75%339 | 75%272 | 75%f155 | 76%f205 | 80%f187 | 75%f226 | 84%f31 | 65%▼101 |
| Burrowby | 72%862 | 72%283 | 72%324 | 71%256 | 73%150 | 71%191 | 73%172 | 69%208 | 75%28 | 74%114 |
| Paddock | 62%752 | 64%251 | 63%284 | 60%217 | 57%118 | 59%158 | 61%144 | 66%a199 | 63%24 | 70%ab▲108 |
| Fernley | 56%677 | 53%208 | 58%262 | 57%208 | 59%122 | 51%▼137 | 56%132 | 61%b▲184 | 52%20 | 54%83 |
| Kestrel & Co | 42%507 | 40%157 | 45%204 | 40%145 | 37%76 | 45%121 | 40%93 | 45%136 | 54%20 | 39%60 |
Columns tested: AGE_GROUP a/b/c; REGION a/b/c/d/e/f; letters mark a result significantly higher than the lettered column. Each column is also tested against the Total (complement method): + / – = significantly higher / lower than Total. Significance testing: two-tailed tests at the 95% confidence level; proportions compared with a pooled two-proportion z-test. Results with a base under 30 are not tested, using effective (Kish) bases under weighting. * base under 50 (use with caution), ** base under 30 (indicative only). Figures are rounded, so percentages may not sum to exactly 100.
▲ / ▼ are shown in-app in place of + / − and indicate significantly higher / lower than Total.
T2
Q7 · Good value for money
Q7 How much do you agree or disagree: Hearthpaw is good value for money
Base: All respondents answering (n=890)
| Total | Age group | Region | ||||||||
|---|---|---|---|---|---|---|---|---|---|---|
| Total | 18-34 | 35-54 | 55+ | London | South East | Midlands | North | Scotland | Wales and South West | |
| a | b | c | a | b | c | d | e | f | ||
| Base (n) | 890 | 300 | 316 | 274 | 157 | 198 | 186 | 210 | 31 * | 108 |
| Strongly disagree | 6%57 | 7%19 | 6%20 | 6%17 | 4%7 | 8%c17 | 3%6 | 7%16 | 5%1 | 9%c9 |
| Disagree | 16%145 | 15%43 | 19%64 | 14%38 | 20%f31 | 15%30 | 17%31 | 18%41 | 11%3 | 9%9 |
| Neither agree nor disagree | 27%241 | 27%79 | 25%85 | 28%76 | 22%34 | 22%46 | 29%54 | 30%69 | 34%11 | 27%28 |
| Agree | 36%322 | 36%105 | 35%118 | 37%99 | 41%64 | 34%70 | 34%64 | 31%69 | 37%11 | 43%d44 |
| Strongly agree | 16%142 | 16%48 | 15%52 | 15%42 | 13%20 | 21%f▲42 | 17%32 | 14%32 | 14%4 | 11%11 |
| Top 2 Box (NET) | 51%464 | 52%153 | 50%170 | 52%141 | 54%84 | 55%112 | 51%96 | 45%▼101 | 50%16 | 54%55 |
| Bottom 2 Box (NET) | 22%201 | 21%62 | 25%84 | 20%55 | 24%37 | 23%47 | 20%37 | 25%57 | 16%5 | 19%19 |
| Mean | 3.38 | 3.41 | 3.35 | 3.41 | 3.39 | 3.44 | 3.46 | 3.27 | 3.44 | 3.37 |
Columns tested: AGE_GROUP a/b/c; REGION a/b/c/d/f (e not tested, base under 30); letters mark a result significantly higher than the lettered column. Each column is also tested against the Total (complement method): + / – = significantly higher / lower than Total. Significance testing: two-tailed tests at the 95% confidence level; proportions compared with a pooled two-proportion z-test; means compared with Welch's t-test (vs Total: two-sample z-test on pooled variance, normal approximation). Means exclude Don't know and other non-answer responses from their base by default. Results with a base under 30 are not tested, using effective (Kish) bases under weighting. * base under 50 (use with caution), ** base under 30 (indicative only). Figures are rounded, so percentages may not sum to exactly 100.
▲ / ▼ are shown in-app in place of + / − and indicate significantly higher / lower than Total.
T3
Q12 · Likely to recommend
Q12 How likely are you to recommend Hearthpaw to a friend or family member?
Base: All respondents answering (n=554)
| Total | Age group | Region | ||||||||
|---|---|---|---|---|---|---|---|---|---|---|
| Total | 18-34 | 35-54 | 55+ | London | South East | Midlands | North | Scotland | Wales and South West | |
| a | b | c | a | b | c | d | e | f | ||
| Base (n) | 554 | 175 | 195 | 184 | 92 | 122 | 125 | 130 | 19 ** | 66 |
| NPS Score | 26 | 28 | 22 | 29 | 32 | 25 | 21 | 31 | 23 | 19 |
Columns tested: AGE_GROUP a/b/c; REGION a/b/c/d/e/f; letters mark a result significantly higher than the lettered column. Each column is also tested against the Total (complement method): + / – = significantly higher / lower than Total. Significance testing: two-tailed tests at the 95% confidence level; proportions compared with a pooled two-proportion z-test. Results with a base under 30 are not tested, using effective (Kish) bases under weighting. * base under 50 (use with caution), ** base under 30 (indicative only). Figures are rounded, so percentages may not sum to exactly 100.
▲ / ▼ are shown in-app in place of + / − and indicate significantly higher / lower than Total.
| Total | Age group | Region | ||||||||
|---|---|---|---|---|---|---|---|---|---|---|
| Total | 18-34 | 35-54 | 55+ | London | South East | Midlands | North | Scotland | Wales and South West | |
| a | b | c | a | b | c | d | e | f | ||
| Base (n) | 554 | 175 | 195 | 184 | 92 | 122 | 125 | 130 | 19 ** | 66 |
| Promoters | 40%228 | 42%71 | 39%81 | 41%76 | 45%42 | 39%51 | 38%48 | 45%59 | 37%7 | 33%21 |
| Passives | 42%234 | 40%67 | 41%84 | 44%83 | 40%37 | 44%58 | 41%51 | 39%52 | 35%7 | 48%30 |
| Detractors | 15%82 | 14%24 | 17%36 | 12%22 | 13%12 | 14%18 | 17%22 | 14%18 | 14%3 | 14%9 |
Columns tested: AGE_GROUP a/b/c; REGION a/b/c/d/e/f; letters mark a result significantly higher than the lettered column. Each column is also tested against the Total (complement method): + / – = significantly higher / lower than Total. Significance testing: two-tailed tests at the 95% confidence level; proportions compared with a pooled two-proportion z-test. Results with a base under 30 are not tested, using effective (Kish) bases under weighting. * base under 50 (use with caution), ** base under 30 (indicative only). Figures are rounded, so percentages may not sum to exactly 100.
▲ / ▼ are shown in-app in place of + / − and indicate significantly higher / lower than Total.
| Total | Age group | Region | ||||||||
|---|---|---|---|---|---|---|---|---|---|---|
| Total | 18-34 | 35-54 | 55+ | London | South East | Midlands | North | Scotland | Wales and South West | |
| a | b | c | a | b | c | d | e | f | ||
| Base (n) | 554 | 175 | 195 | 184 | 92 | 122 | 125 | 130 | 19 ** | 66 |
| 1 | 1%3 | 0%0 | 1%2 | 0%1 | 2%2 | 1%1 | ||||
| 2 | 1%6 | 1%1 | 1%1 | 2%4 | 4%▲5 | 1%1 | ||||
| 3 | 2%9 | 1%2 | 1%2 | 2%4 | 1%1 | 3%4 | 2%2 | 3%1 | 1%1 | |
| 4 | 2%8 | 1%1 | 2%4 | 2%4 | 1%1 | 1%1 | 3%4 | 5%▲3 | ||
| 5 | 4%23 | 6%10 | 3%7 | 3%6 | 6%5 | 5%6 | 3%3 | 4%5 | 6%1 | 2%1 |
| 6 | 6%32 | 6%9 | 9%c▲19 | 2%▼3 | 3%3 | 5%7 | 6%7 | 7%10 | 5%1 | 7%4 |
| 7 | 18%101 | 17%30 | 17%34 | 20%37 | 19%18 | 17%22 | 16%19 | 21%28 | 26%5 | 15%10 |
| 8 | 24%133 | 22%38 | 24%50 | 24%45 | 20%19 | 27%36 | 25%32 | 18%24 | 10%2 | 32%d20 |
| 9 | 19%105 | 17%29 | 19%40 | 20%37 | 20%18 | 21%28 | 17%21 | 19%25 | 13%3 | 17%11 |
| 0 – Not at all likely | 0%1 | 1%1 | 1%1 | |||||||
| 10 – Extremely likely | 22%122 | 25%42 | 20%41 | 21%39 | 25%23 | 18%24 | 21%26 | 26%34 | 24%5 | 16%10 |
| Don't know | 4%21 | 5%8 | 3%7 | 3%6 | 3%3 | 3%4 | 4%5 | 3%4 | 14%3 | 5%3 |
| Mean | 7.95 | 8.08 | 7.88 | 7.92 | 8.04 | 7.97 | 7.78 | 8.07 | 7.92 | 7.90 |
Columns tested: AGE_GROUP a/b/c; REGION a/b/c/d/f (e not tested, base under 30); letters mark a result significantly higher than the lettered column. Each column is also tested against the Total (complement method): + / – = significantly higher / lower than Total. Significance testing: two-tailed tests at the 95% confidence level; proportions compared with a pooled two-proportion z-test; means compared with Welch's t-test (vs Total: two-sample z-test on pooled variance, normal approximation). Means exclude Don't know and other non-answer responses from their base by default. Results with a base under 30 are not tested, using effective (Kish) bases under weighting. * base under 50 (use with caution), ** base under 30 (indicative only). Figures are rounded, so percentages may not sum to exactly 100.
▲ / ▼ are shown in-app in place of + / − and indicate significantly higher / lower than Total.
Take a sample home
See what you would hand to a client
Made by TruStatMind from the Hearthpaw sample study, exactly as it builds them for you.
Sample PowerPoint deck
Download the sample deck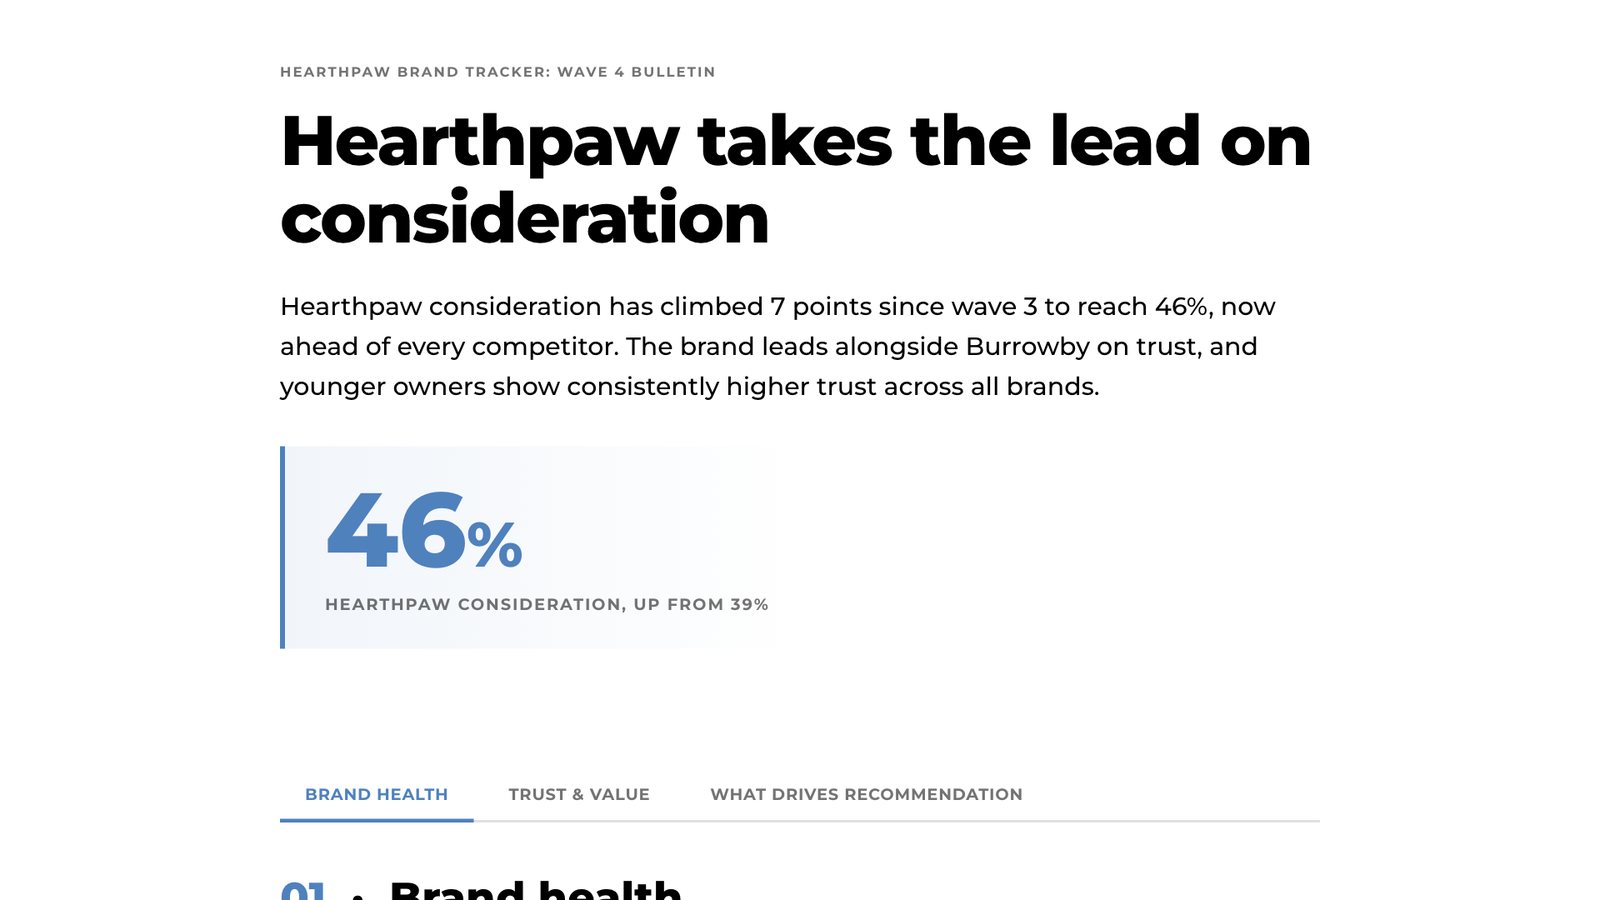
Sample insight bulletin
Open the sample bulletin (opens in a new tab)Your brand colours. Set them once and every deck and bulletin TruStatMind builds uses them.
What researchers said
We’ve met with 20 platform providers. Two or three come close, but this is up there at the top.
You’ve done an amazing job of making it easy to use. I really really love the rationale it gives, and the fact that it is telling me which differences are meaningful and which are not. It will make delving into the data much easier, and importantly I can see our people really doing this and taking this on board. The ease of use hopefully bridges the confidence gap.
Backed by data and analytics consultants
The researchers, data science and analytics consultants who build TruStatMind also help you adopt it: onboarding, workflow design and a second pair of eyes on interpretation, with advanced analytics consulting services when a project needs more than the software.
Explore TruConsulting
Frequently asked questions
Questions about TruStatMind
About the files it reads, the statistics, what you get out and how we look after your data.
Which file formats does TruStatMind read?
SPSS (.sav and .zsav), .csv, .xlsx and .parquet, plus up to three context files such as a questionnaire or brief (.pptx, .pdf or .docx). On upload it reads question types, scales, codes, grids and Don’t know answers, and runs a data report before any analysis starts.
Does it handle weighting and significance testing?
Yes. Weighted tables carry an effective base, and the tests run on it: pooled two-proportion z-tests for percentages and Welch’s t-tests for means, at the 95% level, with letters showing which columns differ. Small bases are flagged on the chart, never hidden.
Can the AI change our numbers?
No. The statistics engine calculates every number directly from your data. The language model plans the analysis and writes the commentary, but it never calculates or changes a figure, and Show the numbers sits under every chart.
Does TruStatMind replace our analysts?
No. It takes on the mechanical work, the tables, tests, charts and a first draft of the story, so researchers spend their time on interpretation and judgement. Every result can be checked against its table.
What do we get out at the end?
Excel tables (the Crosstab agent builds a formatted workbook from your guidance or your tab spec), PowerPoint decks with commentary and speaker notes, and insight bulletins you can share as a web page or a PDF, all in your brand colours.
Is it only for brand trackers?
No. Any quantitative survey works: brand and tracking studies, customer experience, concept and product tests, and wider market research and market analysis. The sample on this page happens to be a brand tracker.
Where is our data hosted, and is it used to train AI?
It’s hosted in the UK on Microsoft Azure, which is ISO 27001 certified, and processing stays in the UK or EU. Your data is never used to train AI, ours or any model provider’s, and numeric analysis never sends respondent-level data to a model.
How much does TruStatMind cost?
Pricing depends on your team’s usage and the support you need. Most teams start with a scoped pilot: book a demo and we’ll put together a proposal.
Book a demoGet started
See TruStatMind on data like yours
Book a demo and we’ll run TruStatMind on a survey like yours, from the data check to the deck, or talk to our data and analytics consulting team about a project.
Or call 020 3002 1700 Email contactus@trustrata.com